


Are derivatives the real underlying asset?
Maybe

Carl Icahn and some deep pocketed traders supposedly bought lots of 4050 puts when /ES was floating between 4150-4200 the other day.
Well, /ES dropped to 4050 the day the puts expired.
Then it became known that the same trader(s) bought 3950 puts that expire next month. The market doesn’t seem to go up when big players are positioned for it to go down.
Why is that? Are they just hedging larger long positions? Are they taking advantage of option flows and the influential affects of dealer positioning?
Lets look into it.
This article:
Explains how developed equity markets are imprudently affected by outsized derivative markets and the actions of market makers.
Breaks down the not-so-subtle difference between real value and notional value by cross referencing the S&P 500 with the Fed’s balance sheet.
Explains how undeveloped crypto markets are less affected by this phenomenon but more affected by others.
One largely overlooked aspect of retail trading is market structure. To be a good trader, just buy or sell before others do.
Predicting when to buy/sell is going to happen is where billions are made, and having a thorough understanding of market structure and how big players are positioned, or how big positions are played, is one of the market’s most predictive resources.
Market Structure
Market Structure encompasses all characteristics of a market such as the number and size of buyers and sellers, competition level, information availability, regulatory environment, and the physical and virtual infrastructures where financial instruments are traded. All of which can significantly affect market efficiency, price discovery, and overall price trajectory.
During Covid times, gamma squeezes became a colloquial term on financial news channels. They represent the phenomenon of dealer positioning (Gary), an inevitable result of how equity markets are structured. In short, when you buy derivatives that profit on the upside on an asset (going long), a dealer can sell you the derivative (going short) and hedge against that by buying the underlying, which is the asset that the derivative is using to base its value on.
When the acceleration of upside derivative purchases increases, so does the purchasing of the underlying by cash-heavy dealers, resulting in exponential rises in price as seen in Gamestop and AMC. Monitoring the call or put volume prior to a gamma squeeze could give actionable insights on how to trade it.
This is what a gamma squeeze looks like.

Consequences of 1987
How can these dealers be so involved if they impact the market so much? The answer is liquidity. Some of these market-making dealers are legally obliged to place bids under specific market conditions. This is meant to protect the infrastructure and price stability of the underlying and became standard practice after the 1987 crash which resulted from an overcrowded trade in portfolio insurance.
The crash was a technical reaction to how the market was structured. - there was no fundamental change that provoked the price collapse. Simply put, there were not enough market-making firms willing to place a bid on that frightful morning. Regulators deemed that unacceptable and market makers have since become one of the primary driving forces of global markets.
The arguably black swan events of 2008 and 2020 were two moments in time where this market-making backstop failed. In both cases, price conditions were so dire that there seemed to be no buyers left - until the central banks made their money printing intentions clear.
Notional Value vs. Real Value
Below is a graph of the S&P 500 index (traded as /ES) priced in USD. It has essentially been up only since 2009 when quantitative easing measures began taking place.
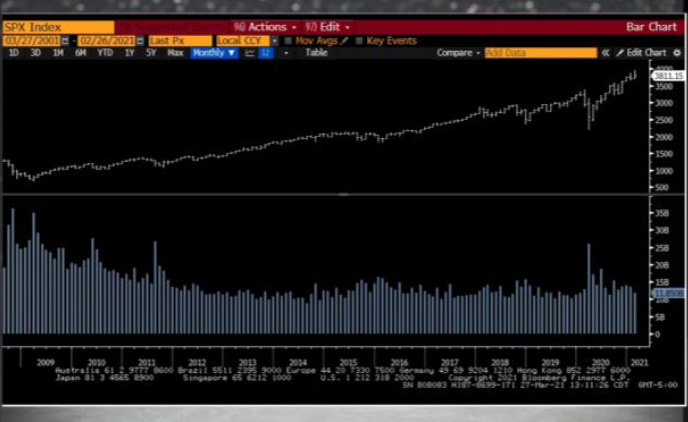
Now compare the index against the Fed’s balance sheet.

As you can see, the value of the index in 2007/2008 was around 0.0016. So for every $1 on the Fed’s balance sheet, there existed ~$0.0016 of value in the S&P 500 index. Quantitative easing and bank bailouts brought floods of new capital into the system and onto the Fed’s balance sheet, pushing the value of the index to the $0.0004/0.0006 territory.
The index has not even come close to its previous highs in relative real value. Meanwhile, in USD notional value, there exists a precipitous rise. This leads to the forgone conclusion that each unit of USD is effectively losing its real value.
In other words, prices are rising. Real value can be measured by notional value less inflation (resulting in spending power) but how do we measure inflation? You can listen to what the Fed reports in its CPI numbers or you can measure your purchases.
Candy is not a Store of Value
Below is a display of candy’s quiet inflation.
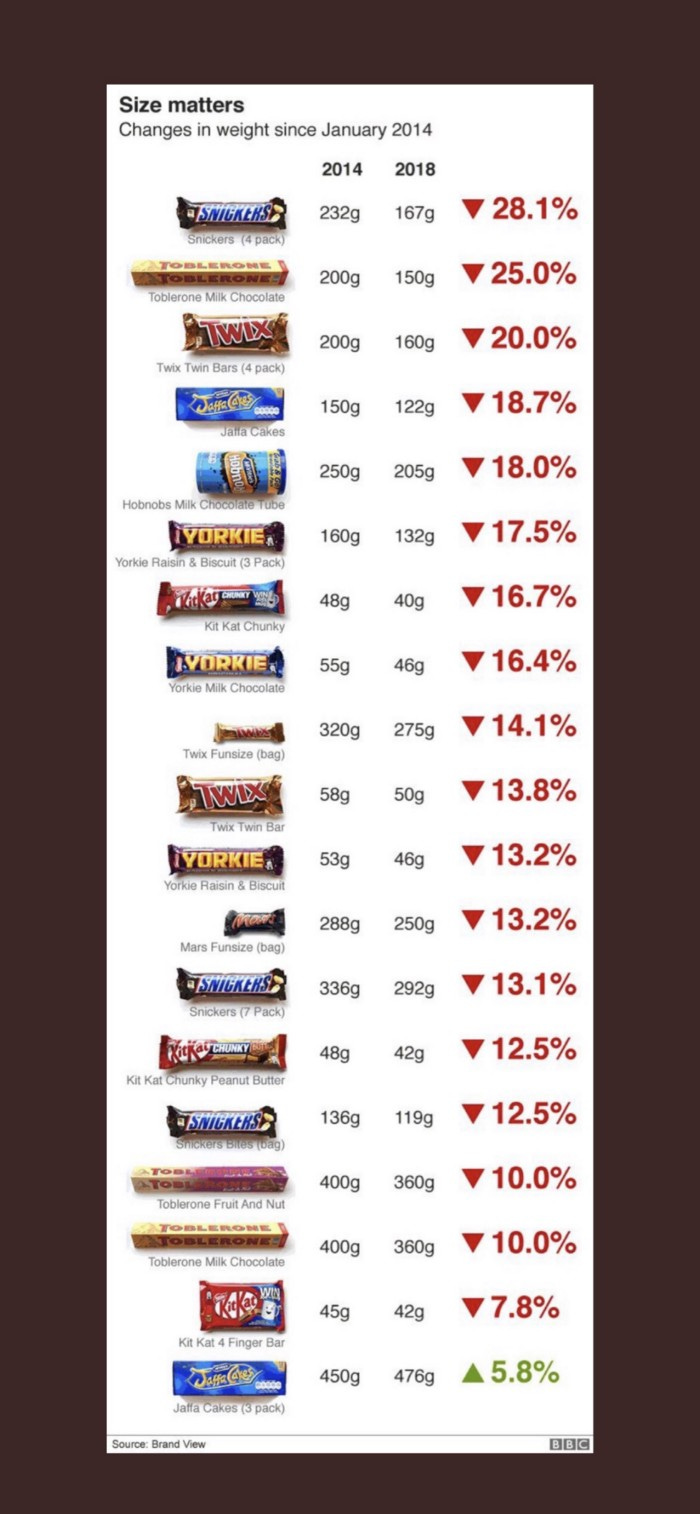
The notional value of these candies has not changed, yet the real value of what you are purchasing has declined substantially. This pattern of decreasing returns and/or increasing prices is common across many industries such as education, groceries, commodities, ride-sharing services, and streaming platforms. It’s is not a specific issue, its a systemic problem.
Asset Scarcity
Dan Held, the previous head of growth at the Kraken crypto exchange, recently posted an interesting perspective on the relative value of US dollars.
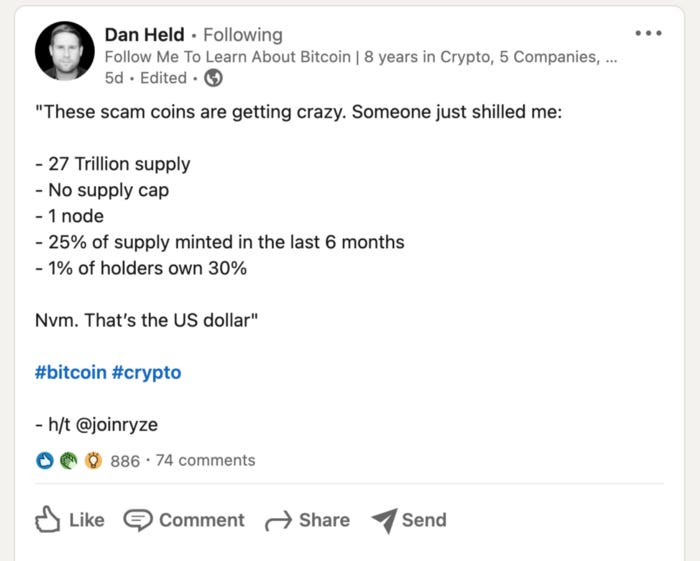
Scarcity, physical or digital, has made its way to the front lines of the debate on asset valuation. One thing is certain; the US dollar is not scarce, and neither are the derivatives tied to it.
According to Visualist Capitalist’ research on the world’s money supply, the global derivatives markets outsize the world’s stock markets by a factor of 11.
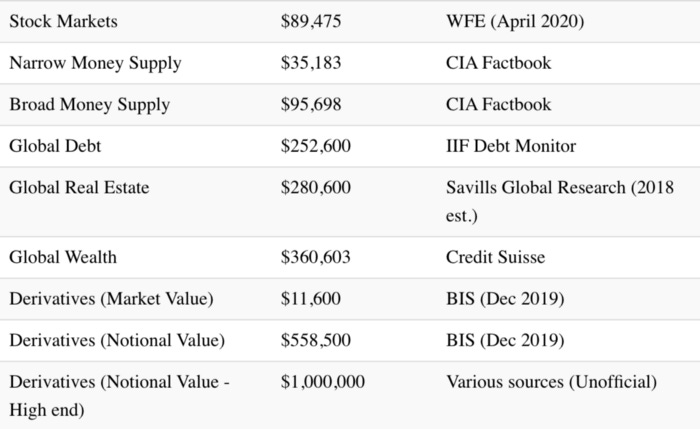
A modest estimate of the world’s derivatives is $1,000,000,000,000,000. One quadrillion US dollars.

If that estimate is correct, then for every $1 in a stock market, there are $11 in derivatives. These $11 serve a variety of purposes such as supply-side hedging but most are cash-settled speculations. These are side-bets, bets on side-bets, and bets on bets on side-bets. The sheer quantity of the value of side bets changes how the initial bet plays out.
It’s similar to the reflexivity principle discussed by George Soros or the concept of Gary as described by legendary market maker and fund manager, Cem Karsan.
The Observer Effect
Physicists deal with the same issues of reflexivity as financial markets, but in a more fundamental sense — the observer effect.
“In physics, the observer effect is the disturbance of an observed system by the act of observation.[1] [2] This is often the result of instruments that, by necessity, alter the state of what they measure in some manner. A common example is checking the pressure in an automobile tire; this is difficult to do without letting out some of the air, thus changing the pressure. Similarly, it is not possible to see any object without light hitting the object, and causing it to reflect that light. While the effects of observation are often negligible, the object still experiences a change.”
Financial markets are dynamic entities with infinitely complex combinations of observers and their intentions. This observer effect is compounded through the use of derivatives.
Crypto Market Structure
Things are slightly different in crypto.
The whales in the equity markets are usually large traditional funds or market makers. The whales in crypto, on the other hand, are often early adopters, emerging funds, or individual traders with large risk tolerances.
For large traders, simply opening a position can cause a market to rise or fall, especially in lower market cap / less liquid altcoins. When Doge had a ~$40 billion market cap, nearly half of its supply was held by a handful of wallets. What if these wallets colluded and decided to market sell at the same time?
These dynamics creates levels of sustained volatility unmatched in traditional equity markets, aside from perhaps penny stocks or OTC stocks where market caps are small and majority share owners can (temporarily) get away with acting shady to pump or dump prices.
Volatility as a Feature
This volatility has proven itself to be a feature, rather than a bug. Due to the way crypto exchanges operate and distribute leverage, cascading liquidations can easily result from large traders moving positions.
In a sense, the cascading liquidations are crypto’s version of a decentralized gamma squeeze across centralized exchanges. This liquidation effect is present in traditional markets as well but to a much smaller extent because of the standards practiced since the 1987 crash, the relative size of retail traders when compared to institutional investors, and leverage distributions.
So which is the underlying asset?
It varies. Sometimes spot equities lead derivative price action and vice versa. In crypto, it’s not so clear. Crypto derivatives are relatively niche in comparison to equity derivatives and their notional value is far less. The existence of multiple crypto futures exchanges, funding rates, on-chain activity, and price discounts/premiums are other factors that muddy the answer.
For example, there have been times Bitcoin futures traded 10% higher on Coinbase than on other exchanges. This simply doesn’t happen on the single exchange (CME) where all /ES futures contracts are traded. Bitcoin’s premium has been as high as 20% in South Korea due to restrictions on foreigners trading the South Korean Won — it eventually gets arbitraged out or resets to equilibrium, but that is a non-existent phenomenon in equity markets.
The lack of standardized futures contracts and the use of many different price oracles in cryptocurrency markets creates a complex and uncorrelated web of price data that has yet to be demonstrated to have the same impact on crypto spot transactions as evidenced in traditional markets.
As crypto derivatives markets mature, will they become as reflexive as equity markets?
Only time will tell.